BACK TO INSIGHTS
Profitability11 min read·May 18, 2026

Amazon Contribution Margin: The P&L Math That Should Set Your Ad Budget

Most sellers size ad spend off revenue and a copied ACoS target. Here is the per-unit contribution model that decides how much you can actually spend before every order loses money.

FA
Feroz Arshad
Founder, Spenzio
Flat dark-mode contribution-margin waterfall: a $39.99 Amazon sale stepping down through referral, fulfillment, storage, returns, COGS, and freight to a $14.94 (37.4%) contribution bar highlighted in amber.

Why Revenue and ACoS Are the Wrong Budget Triggers

Most brands size their Amazon ad budget off two numbers: last month's revenue and a target ACoS. Both are blind to the only figure that decides whether growth is worth buying. 
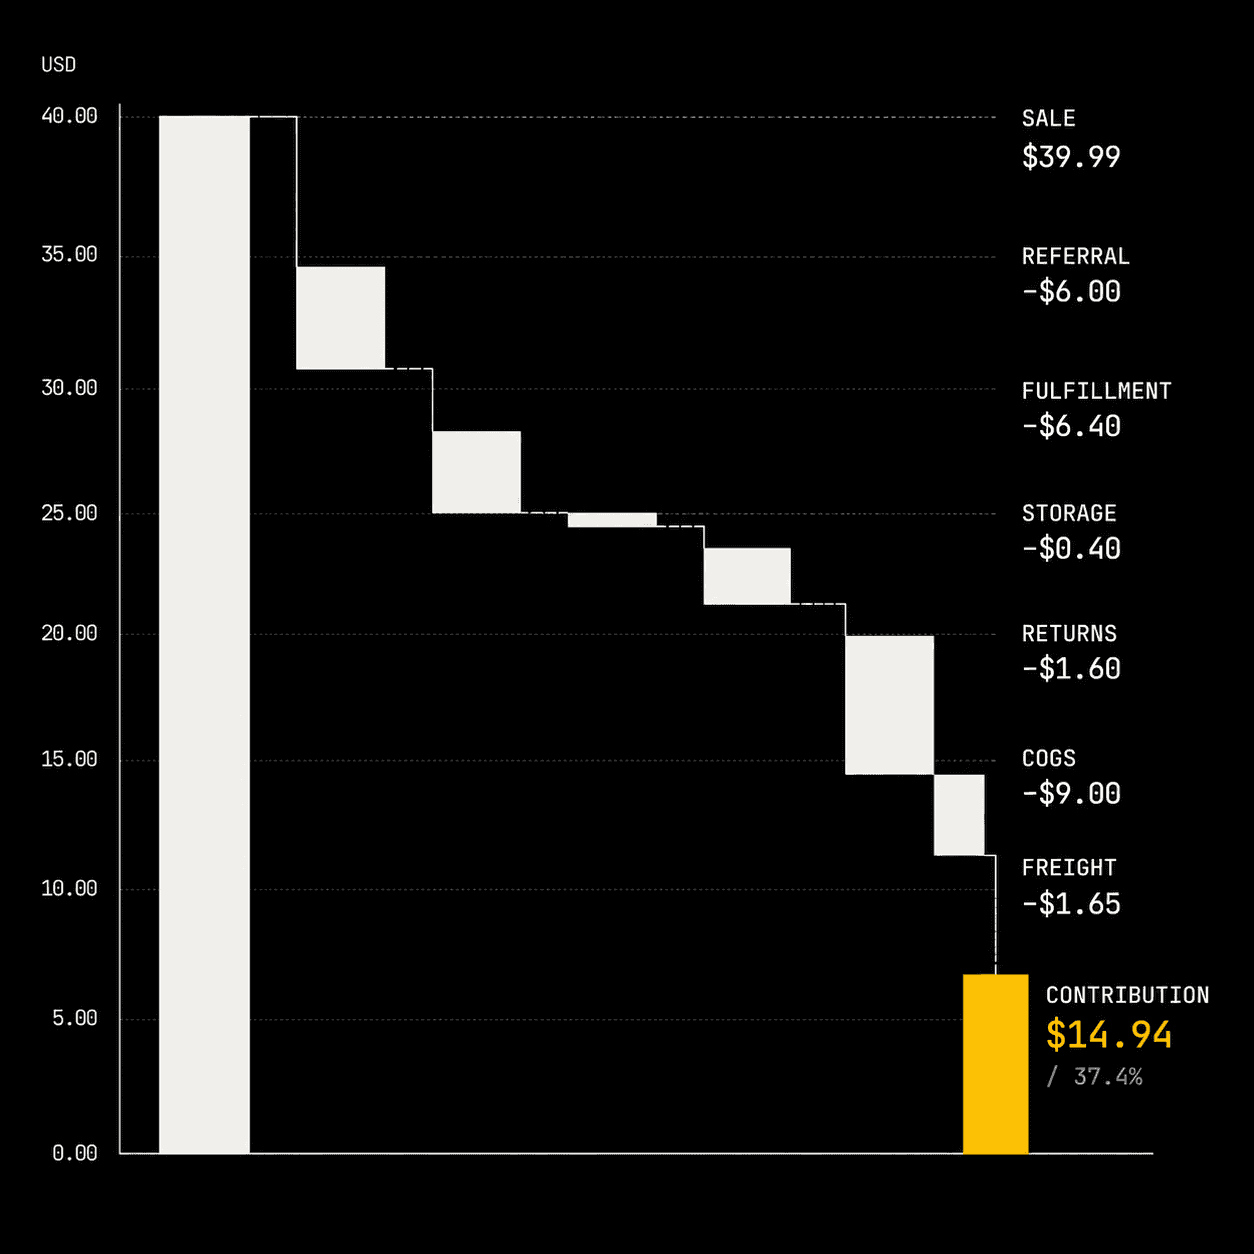
A 25% ACoS looks safe until you learn the product carries an 18% contribution margin after fees, freight, and returns. At that point every ad-driven order loses money you will never see in the ad console. We have audited accounts spending $40,000 a month at a comfortable ACoS that were quietly destroying roughly $6,000 of contribution every month. Revenue tells you size. ACoS tells you ad efficiency. Neither tells you whether the next dollar earns or burns. That answer lives in the per-unit P&L, and most sellers have never built it.

The Amazon Fee Stack Nobody Fully Counts

Before margin, list every dollar Amazon and logistics take. Sellers reliably count the referral fee and forget the rest. On a typical $39.99 FBA unit: a 15% referral fee is $6.00, the fulfillment fee runs $5.50 to $7.30 by size tier, and monthly storage adds $0.20 to $0.90 with Q4 surcharges. Then the silent ones. Returns at an 8% rate in a category with 50% non-resellable units cost another $1.60 per unit sold, and inbound placement plus prep adds $0.45. Add COGS of $9.00 and landed freight of $1.20. The fee and logistics stack alone absorbs 45% to 60% of the sale price before a single ad click. If you have not written this list per ASIN, your margin is a guess.

Building the Per-Unit Contribution Waterfall

Now stack it into a waterfall, top line down to contribution. One ASIN, real structure, illustrative numbers. Sale price $39.99. Minus referral $6.00, fulfillment $6.40, storage $0.40, returns reserve $1.60, COGS $9.00, freight and prep $1.65. Pre-ad contribution is $14.94, which is 37.4% of revenue. That 37.4% is the budget envelope. Everything the ad system may spend on this unit comes out of $14.94, not out of $39.99. Teams that reason from the $39.99 feel rich. The P&L reasons from $14.94 and tells the truth.

The Three Margin Tiers

Once every ASIN has a contribution percentage, the catalog sorts itself into three tiers. This is the same tiering the campaign-architecture guide on this blog builds budgets around. Tier A is above 35% contribution. It can fund aggressive discovery and still print profit. Tier B sits at 20% to 35% and scales only against proven search terms. Tier C is under 20%, defended and harvested, never pushed with broad spend. A 12% TACoS is reckless on a Tier C unit and correct on a Tier A one. The tier, not the ASIN's revenue, sets how hard you may push. Sort first. Spend second.

Set the Ad Budget From Margin, Not Revenue

Here is the formula that replaces revenue-based budgeting. Maximum profitable ad cost per unit equals contribution dollars minus your target profit per unit. Take the $14.94 unit. If the brand wants to keep $6.00 of real profit per unit during a scaling quarter, the ad system may spend up to $8.94 per unit sold. On a $39.99 price that is roughly a 22% break-even-to-target ACoS, and a blended TACoS ceiling near 11% once organic carries its share. Notice what changed. The budget now comes from margin and a profit goal, not a 25% ACoS target someone copied last year. Two ASINs at the same price and same ACoS can have completely different correct budgets. Margin decides. Price does not.

Break-Even ACoS and the TACoS Ceiling

Every ASIN has a break-even ACoS, the point where ad cost equals contribution. Profit is zero there. Compute it once per ASIN and post it where the team sets bids. Break-even ACoS equals the pre-ad contribution margin percentage. The $14.94 unit at 37.4% has a 37.4% break-even ACoS, so any campaign above that pays to lose money on that unit. A working target sits well under it, often 55% to 65% of break-even during profit quarters and up to 85% during a deliberate rank push. The account-level ceiling follows the same logic. If blended contribution is 34% and you accept 12 points as growth tax, the TACoS ceiling is 12%. The TACoS-versus-ACoS guide on this blog covers why that blended number is the real scoreboard.

Re-Baseline Every Quarter

Contribution margin is not a one-time spreadsheet. It drifts, and the drift runs against you. Amazon raised multiple FBA and low-inventory fees across 2024 and 2025, and a single 3% COGS increase from a supplier moves a 37% margin to 33% without anyone touching a bid. That four-point move can push a Tier A unit toward Tier B and quietly turn a profitable campaign into a loss. Re-pull the waterfall every 90 days and after any fee-schedule change. The teams that win are not the ones with the cleverest bids. They are the ones whose margin model is current. Stale math scales losses.

The Operating Takeaway

Budget from contribution, not revenue. Sort the catalog into margin tiers, derive a per-unit ad ceiling from the waterfall, and re-baseline every 90 days. Do that and the ad account stops being a guess. One brand that moved to this model held 31% blended contribution while growing units 27% across two quarters, because spend finally tracked margin instead of revenue. The intent-signals and campaign-structure guides on this blog show how to wire the bidding to these ceilings. One number runs the channel. It is the small one.
Contribution MarginAmazon ProfitabilityTACoSUnit Economics
SPENZIO MARGIN PROMISE

Need help implementing these strategies?

Get a free 47-point audit of your Amazon account. We'll identify the biggest opportunities for profitable growth.